
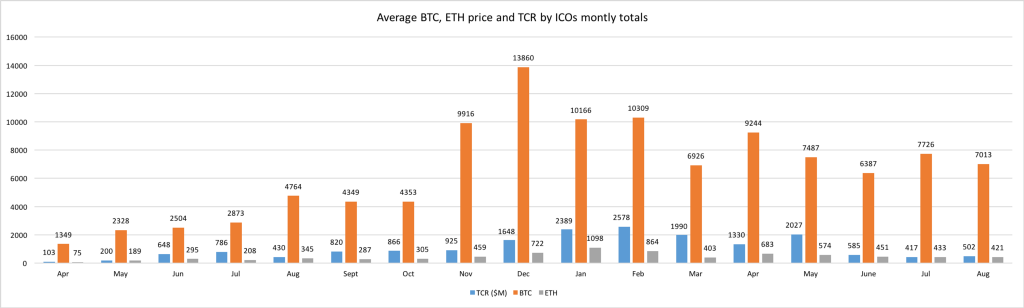
Above chart represents average BTC, ETH value in dollars per month and Total Capital Raised by ICOs (represented in million $) — monthly totals 2017–2018.
There are few things to notice:
The highest average amount by month:
BTC: $13,860 — December 2017
ETH: $1,098 — January 2018
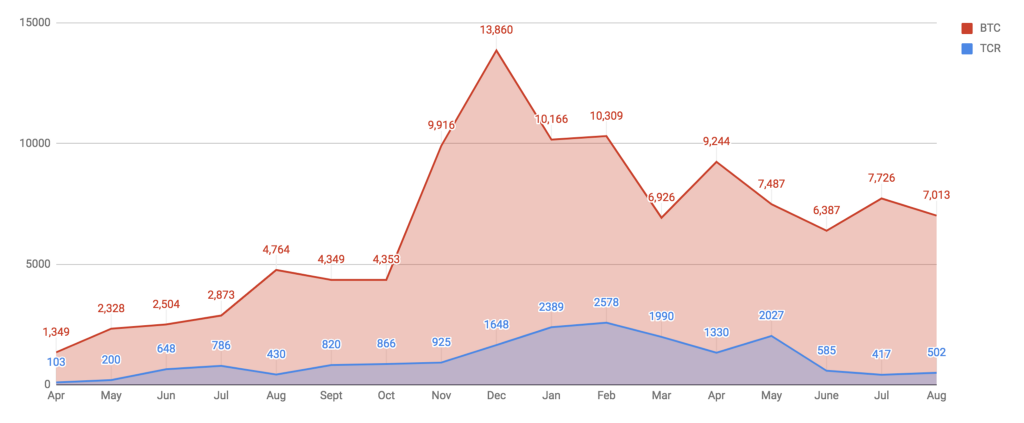
Total Capital Raised by ICOs: $2,578,000,000 — February 2018
Total raised by ICOs
- In 2017 equals $7.0 billion
- In 2018 by August equals $11,818 billion
Two biggest (all time) amounts raised per month took place in January and February 2018 just one month after highest average price per BTCs.
They were almost $4,967,000,000.
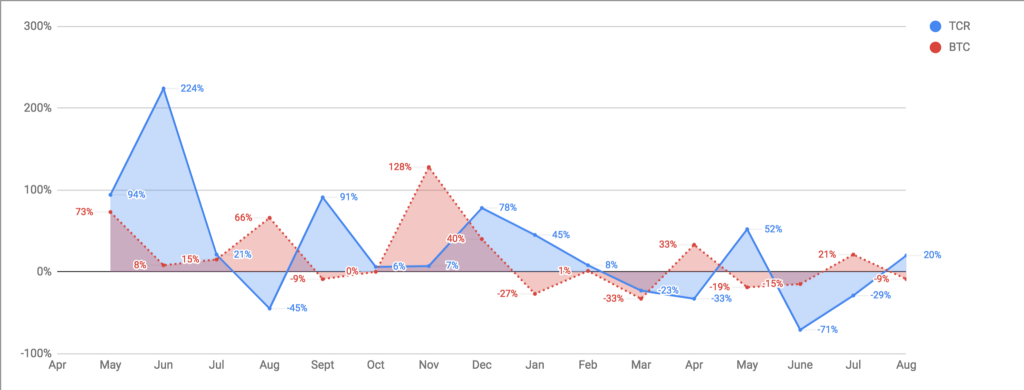
Highest percentage increase by one month:
BTC: 127.80% — Nov 2018
- Increased from $4,353 to $9,916 per BTC
ETH: 152.00% — May 2017
- Increased from $75 to $189
TRC: 224.00% — June 2017
- Increased from $200,000,000 to $648,000,000
Altho the percentage growth doesn’t give us accurate data about the price, we can analyze other things such as time of occurrence. Analyzing the percentage graph we can see that:
- TRC have positive spike one month after BTC increase almost every time.
- After a decrease of BTC price we usually experience a decrease in TRC
Data gathered from ICOdata and TokenData
Total Capital Raised by ICO’s vs BTC and ETH was originally published in MVP Workshop on Medium, where people are continuing the conversation by highlighting and responding to this story.